Products
This website presents the lineup of industrial components and their datasheets that OMRON corporation provides on a global basis. For more detailed information specific to your area, please select a country from the "Country Websites" menu on the right in order to visit your local OMRON IA website.
Product Category
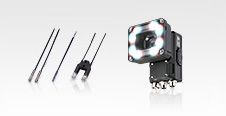
 Sensors
OMRON Sensing Components detect, measure, analyze, and process various changes that occur on productions sites, such as changes in position, length, height, displacement, and appearance. They also contribute to predicting and preventing future events.
-
Fiber Sensors
-
Photoelectric Sensors
-
Displacement Sensors / Measurement Sensors
-
Vision Sensors / Machine Vision Systems
-
Code Readers / OCR
-
Proximity Sensors
-
Photomicro Sensors
-
Rotary Encoders
-
Ultrasonic Sensors
-
Pressure Sensors / Flow Sensors
-
Contact Sensors / Liquid Leakage Sensors
-
Condition Monitoring Sensors
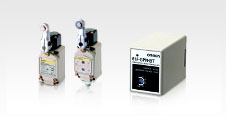 Switches
OMRON provides Basic Switches that operate when objects reach specific locations and Pushbutton Switches operated by people.
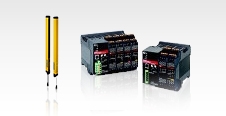 Safety Components
Safety Components are required for safety countermeasures in equipment and facilities. They are used for shut-out detection of mechanical guards, checking intrusion into hazardous areas, and building safety circuits.
-
Safety Sensors
-
Safety Light Curtains / Safety Multi-Light Beams / Single-beam Safety Sensors
-
Safety Laser Scanners
-
Safety Door Switches
-
Safety Limit Switches
-
Emergency Stop Switches
-
Safety Key Selector Switches / Enabling Grip Switches
-
Safety Controllers
-
Safety Units / Safety Relay Units
-
Safety Relays
-
Safety Drives
 Relays
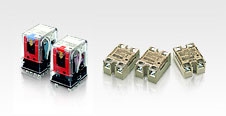
Relays are devices making or breaking electric circuits by their output section driven by operational signal, which is triggered by electric input signal controlled by switching devices.
 Control Components
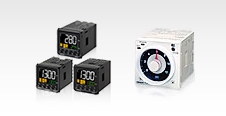
Control Components provide ideal control at production site through Counters, Cam Positioners, Timers, Timer Switches, Digital Temperature Controllers, and other input, control, and output components.
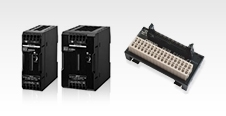
 Automation Systems
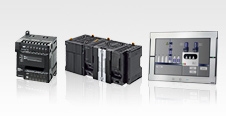
Automation Systems include Programmable Controllers that support machine control, and Network/Software products to support easy information exchange with host systems.
 Motion / Drives
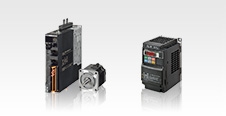
Servo motors and inverters ideal for positioning, speed and torque controls in various business machine control fields.
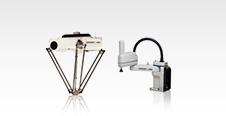 Robotics
Robot arms, robot controllers, and vision systems for flexible production lines.
 Inspection System
This Inspection System is suitable for various SMT production needs.
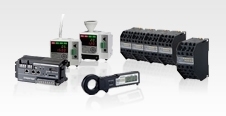 Energy Conservation Support / Environment Measure Equipment
Electric power monitoring equipment for energy conservation support, sensing and control equipment for an environment sensing in the clean room.
 Power Supplies / In Addition
OMRON provides Power Supplies, Protective Components, Wiring Systems, Sockets, DIN Rails, and other components required on manufacturing sites.